Basic quality control for a plate experiment
Plate experiment with the following description:
test experiement for rosettR
Plate layout
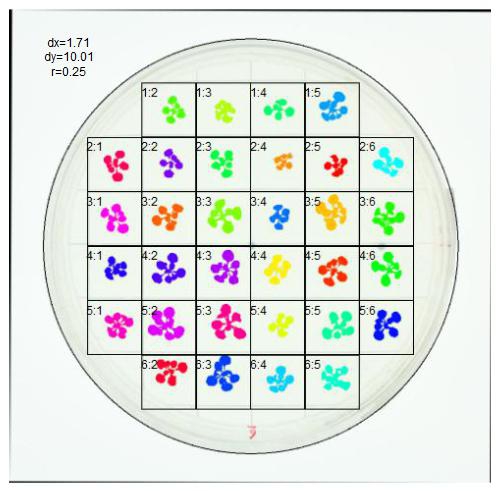
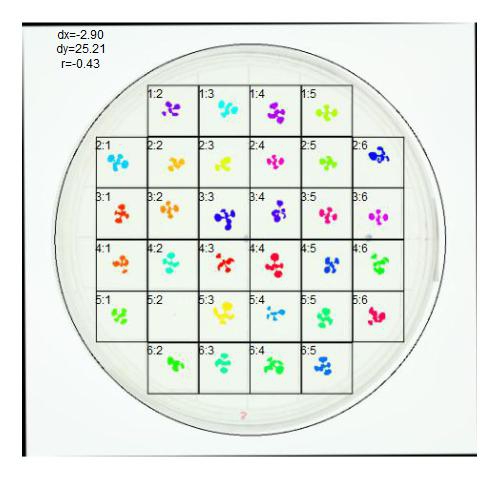
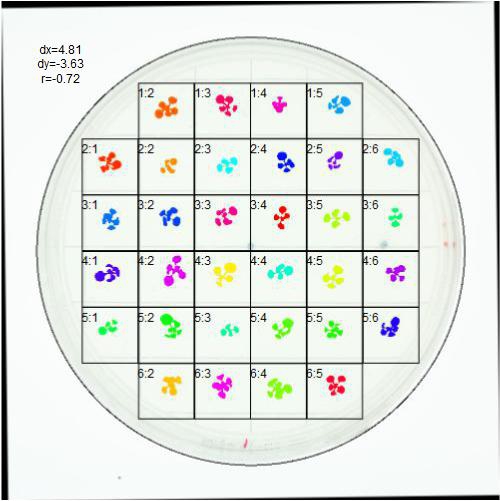
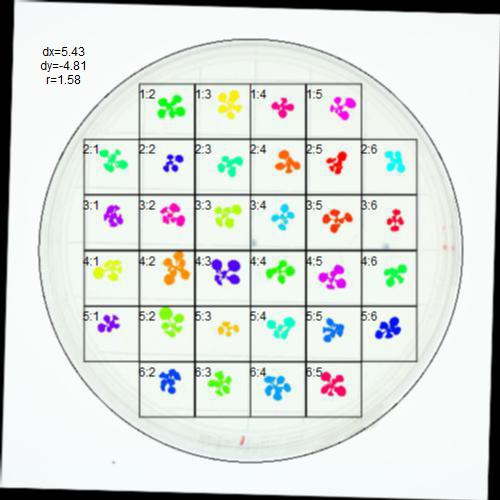
The images were interpreted like this, using plate001.jpg as an example
| 1 | 2 | 3 | 4 | 5 | 6 | |
|---|---|---|---|---|---|---|
| 1 | ,c,1,foo | ,c,2,foo | ,d,1,bar | ,d,2,bar | ||
| 2 | ,c,3,foo | ,c,4,foo | ,c,5,foo | ,d,3,bar | ,d,4,bar | ,d,5,bar |
| 3 | ,c,6,foo | ,c,7,foo | ,c,8,foo | ,d,6,bar | ,d,7,bar | ,d,8,bar |
| 4 | ,b,1,baz | ,b,2,baz | ,b,3,baz | ,a,1,qux | ,a,2,qux | ,a,3,qux |
| 5 | ,b,4,baz | ,b,5,baz | ,b,6,baz | ,a,4,qux | ,a,5,qux | ,a,6,qux |
| 6 | ,b,7,baz | ,b,8,baz | ,a,7,qux | ,a,8,qux |
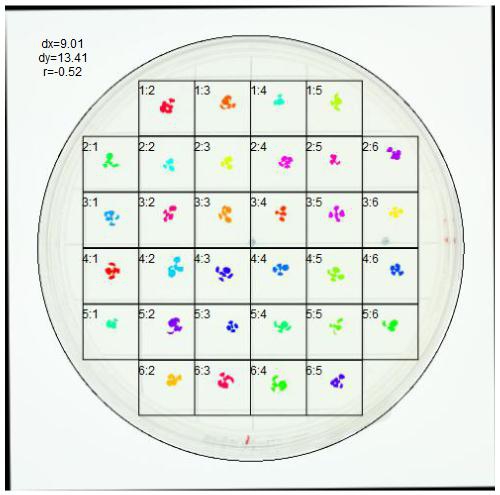
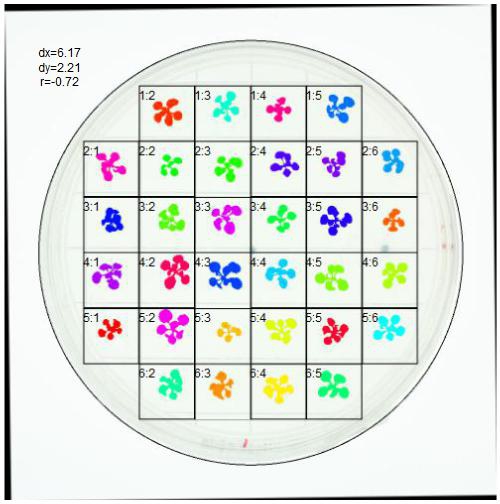
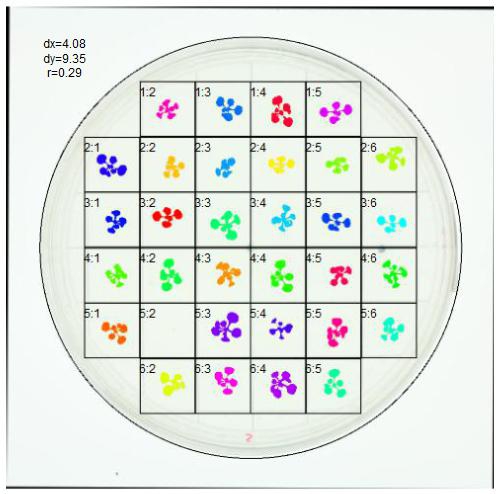
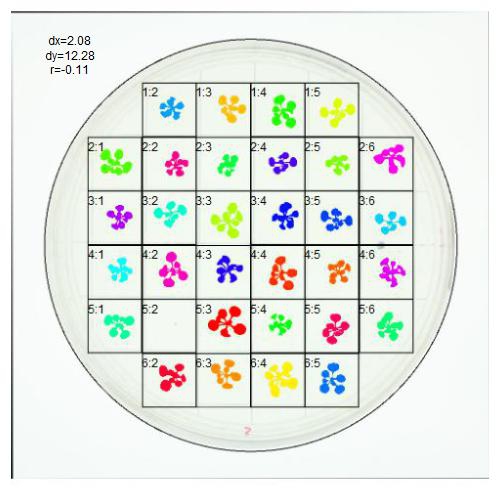
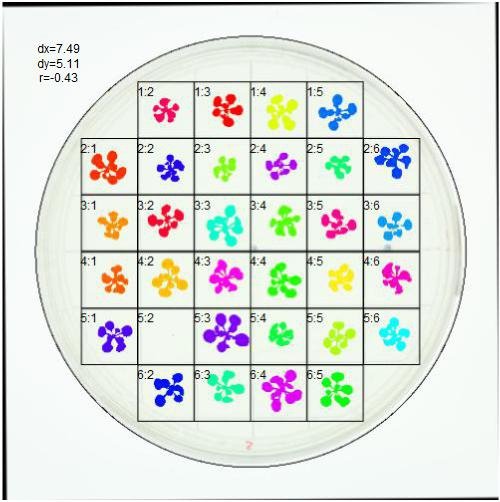
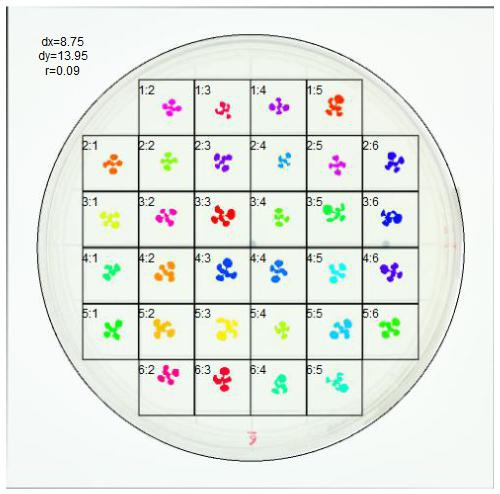
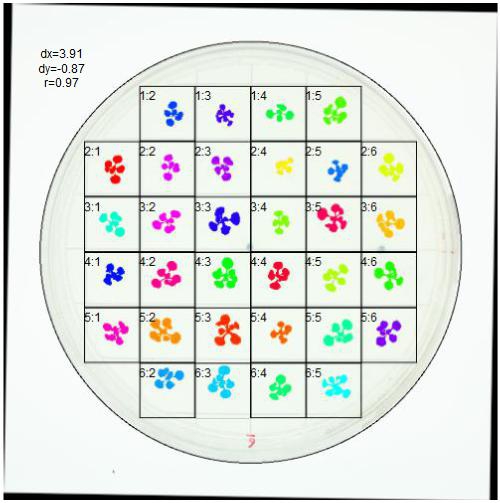
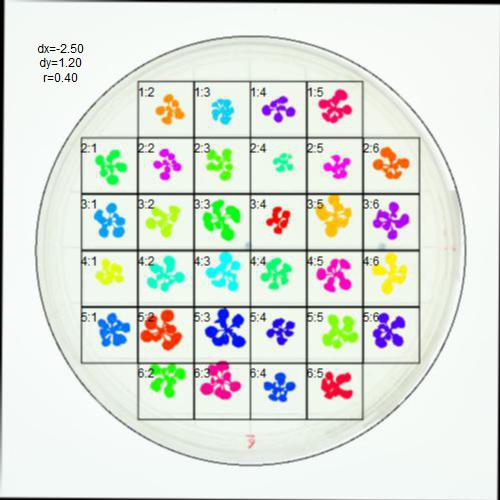
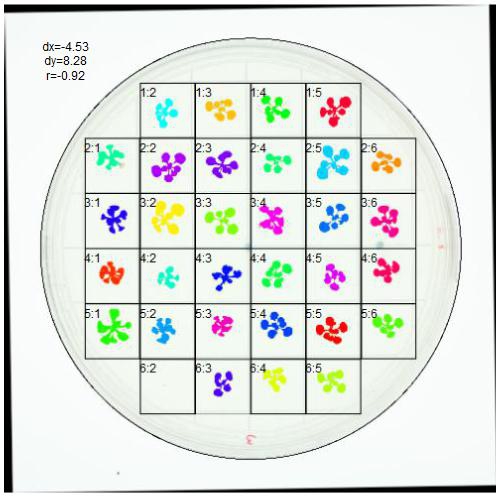
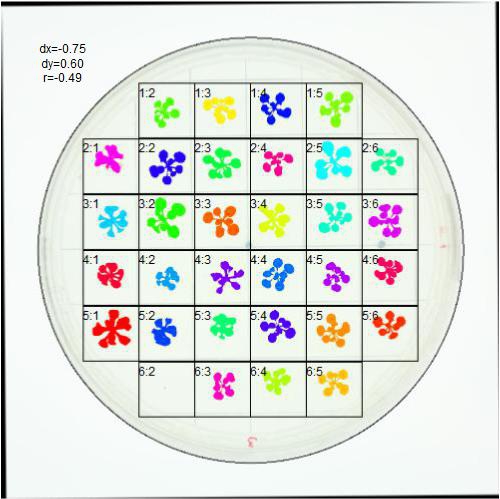
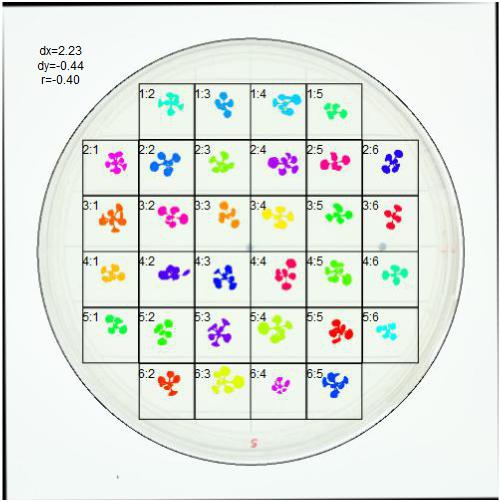
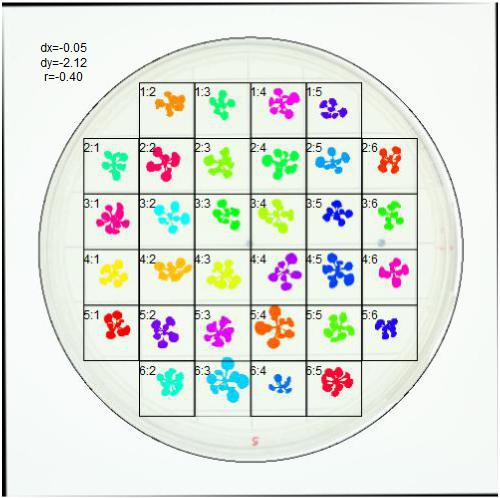
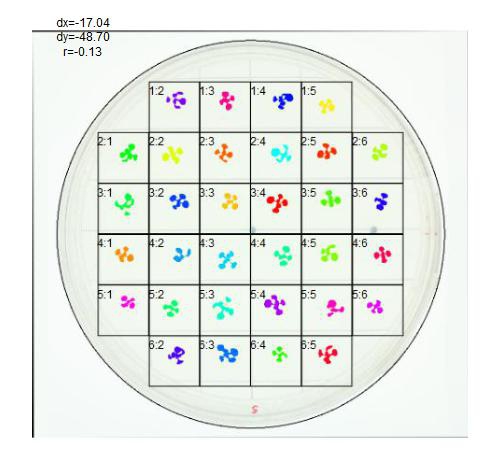
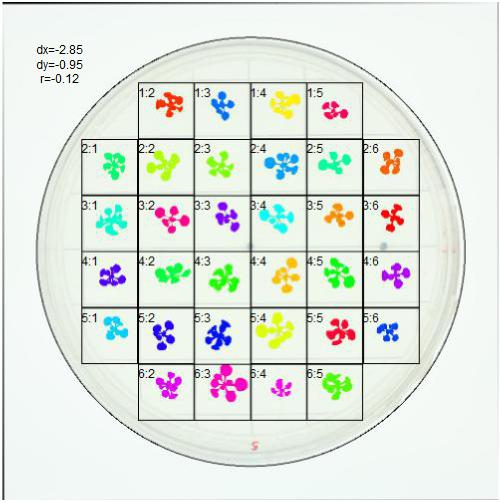
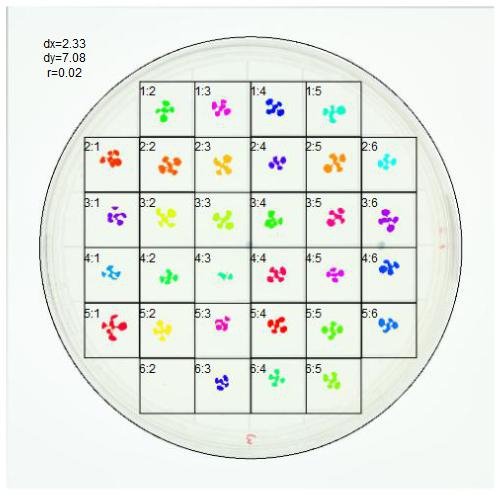
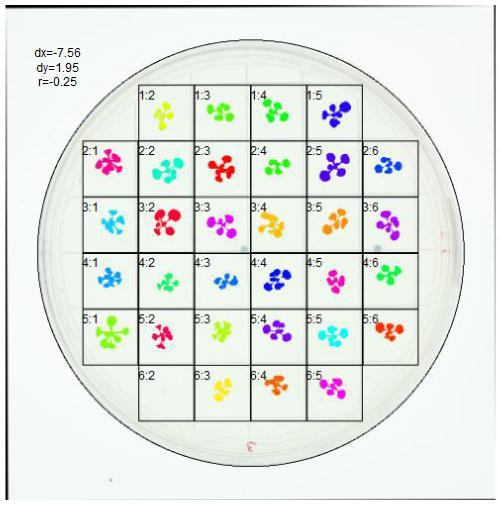
Image analysis
An overview of the analyzed images are given below. Each row is the same plate over the different days in columns. Hover with the mouse cursor over an image to see the plate number.
Make sure that the black outline of the plate is directly around the
plate. If not, consider re-calibrating the zoom factor using
calibrateScale(). Also check that each plant is colored with its own
color, and not merged with plants in neighboring boxes.
If any plate look like it is not correctly corrected in terms of
- rotation
- horizontal or vertical displacement
- threshold (separating background from the plant)
you may want to re-process those images (see package vignettes for how
to do that). If a plate has contamination or in any other way bad data
you may want to mark those as 'removed' by using the removeBoxes()
function.


Growth curves
These are the growth curves over the monitored days as estimated by the image analysis. Negative day to day differences most likely indicates some technical problem that needs to be corrected.

Wells that had decreasing estimated plant areas (and therefore likely problematic) were:
| plate | RANGE | ROW | negativeGrowth | |
|---|---|---|---|---|
| 385 | plate004.jpg | 1 | 2 | TRUE |
Quality control results
Table showing different quality control statistics for the plates. Check that the included plates are of acceptable quality and remove failed plates using the removeBoxes() function before recompiling this report.
rotation the clockwise rotation correction in degrees that was applied to the plate. Missing value indicates that no rotation was done. An absolute value close to the maximum tested rotation may indicate poor quality.
eccentricity an estimate for how far away the plate deviates from the center in millimeter. A large value may indicate poor quality but the plate detection algorithm is unstable an often over-estimates this value.
ambiguous boxes the number of boxes on the plate that had features that could not be resolved to a specific boxes and hence treated by hard-splitting of the box and summing features. A number greater than 0 indicates poor quality.
max_features the maximum number of features found in a single box. A large number (e.g., >8) indicates that at least one box contains an object that is not a single plant since these typically do not generate more than 5-6 features.
We use boxplots to detect outliers.
Individual plates that have excessively large or small seedlings should be considered for removal.

If a plant is too small at any one day, it will be marked as “removed” over the whole time-series. We make a table of the number of removed plants per genotype. Individual plants (or plate-boxes more accurately) may also be removed manually. We create table to monitor how many observations for each replicate set have been removed.
| timepoint | GENOTYPE | treatment | number removed | removed (%) |
|---|---|---|---|---|
| 11 | bar | control | 0 | 0.00 |
| 11 | bar | osmotic | 0 | 0.00 |
| 11 | baz | control | 0 | 0.00 |
| 11 | baz | osmotic | 0 | 0.00 |
| 11 | foo | control | 0 | 0.00 |
| 11 | foo | osmotic | 0 | 0.00 |
| 11 | qux | control | 0 | 0.00 |
| 11 | qux | osmotic | 0 | 0.00 |
| 14 | bar | control | 0 | 0.00 |
| 14 | bar | osmotic | 0 | 0.00 |
| 14 | baz | control | 0 | 0.00 |
| 14 | baz | osmotic | 0 | 0.00 |
| 14 | foo | control | 0 | 0.00 |
| 14 | foo | osmotic | 0 | 0.00 |
| 14 | qux | control | 0 | 0.00 |
| 14 | qux | osmotic | 0 | 0.00 |
| 16 | bar | control | 0 | 0.00 |
| 16 | bar | osmotic | 0 | 0.00 |
| 16 | baz | control | 0 | 0.00 |
| 16 | baz | osmotic | 0 | 0.00 |
| 16 | foo | control | 0 | 0.00 |
| 16 | foo | osmotic | 0 | 0.00 |
| 16 | qux | control | 0 | 0.00 |
| 16 | qux | osmotic | 0 | 0.00 |
| 18 | bar | control | 0 | 0.00 |
| 18 | bar | osmotic | 0 | 0.00 |
| 18 | baz | control | 0 | 0.00 |
| 18 | baz | osmotic | 0 | 0.00 |
| 18 | foo | control | 0 | 0.00 |
| 18 | foo | osmotic | 0 | 0.00 |
| 18 | qux | control | 0 | 0.00 |
| 18 | qux | osmotic | 0 | 0.00 |
timepoint
| timepoint | number removed | removed (%) |
|---|---|---|
| 11 | 0 | 0.00 |
| 14 | 0 | 0.00 |
| 16 | 0 | 0.00 |
| 18 | 0 | 0.00 |
GENOTYPE
| GENOTYPE | number removed | removed (%) |
|---|---|---|
| bar | 0 | 0.00 |
| baz | 0 | 0.00 |
| foo | 0 | 0.00 |
| qux | 0 | 0.00 |
treatment
| treatment | number removed | removed (%) |
|---|---|---|
| control | 0 | 0.00 |
| osmotic | 0 | 0.00 |
The table below lists the number of outliers per plate. Plates with very large number of outliers should be inspected and considered for removal.
| plate | not_outlier | outlier | qc_picture | empty_plates |
|---|---|---|---|---|
| plate005.jpg | 120 | 8 | D11/qc_plate005.jpg , D14/qc_plate005.jpg , D16/qc_plate005.jpg , D18/qc_plate005.jpg | no |
| plate004.jpg | 125 | 3 | D11/qc_plate004.jpg , D14/qc_plate004.jpg , D16/qc_plate004.jpg , D18/qc_plate004.jpg | no |
| plate003.jpg | 126 | 2 | D11/qc_plate003.jpg , D14/qc_plate003.jpg , D16/qc_plate003.jpg , D18/qc_plate003.jpg | no |
| plate002.jpg | 127 | 1 | D11/qc_plate002.jpg , D14/qc_plate002.jpg , D16/qc_plate002.jpg , D18/qc_plate002.jpg | no |
| plate001.jpg | 128 | 0 | D11/qc_plate001.jpg , D14/qc_plate001.jpg , D16/qc_plate001.jpg , D18/qc_plate001.jpg | no |
| plate006.jpg | 128 | 0 | D11/qc_plate006.jpg , D14/qc_plate006.jpg , D16/qc_plate006.jpg , D18/qc_plate006.jpg | yes |
This report was compiled on Sun Jan 10 11:22:31 2016 by GBFJC on Windows using rosettR v0.0.3